- 21103 Vanowen St Woodland Hills, CA 91303 | Call us today!
- 310-879-9266
GH Replacement Therapy in Growth Hormone Deficient Adults
Sequence of hormone loss in hypopituitarism depending on location of a benign tumor
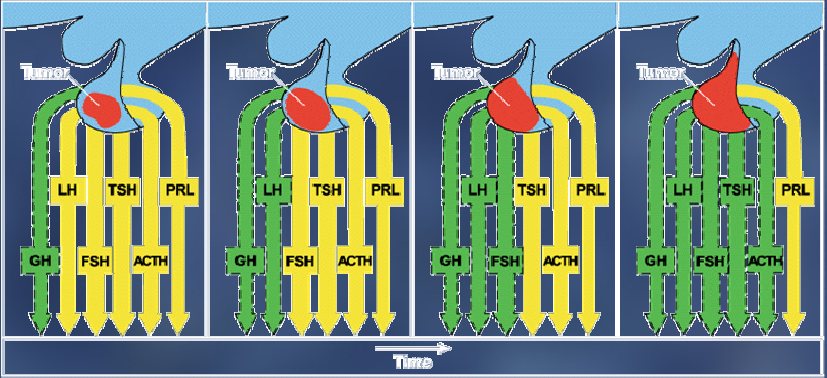
Besser GM, Cudworth AG, eds. Clinical endocrinology: an illustrated text. London: Gower Medical Publishing, 1987
Patients with other pituitary hormone deficiencies are more likely to be GH deficient
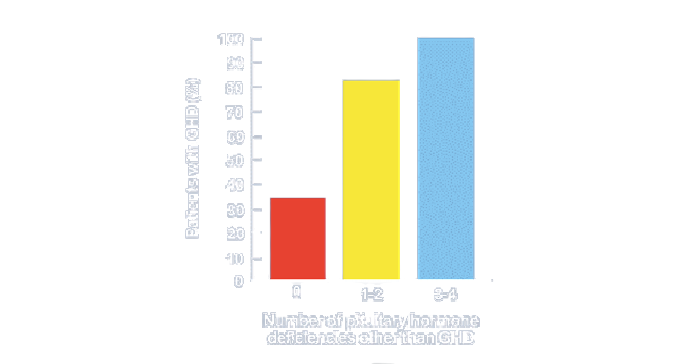
önksen PH et al. In: Adashi EY, Thorner MO, eds. The somatotrophic axis of the reproductive process in health and disease. New
York: Springer-Verlag, 1995
GH deficiency is related to the extent of hypopituitarism and other hormone deficiencies
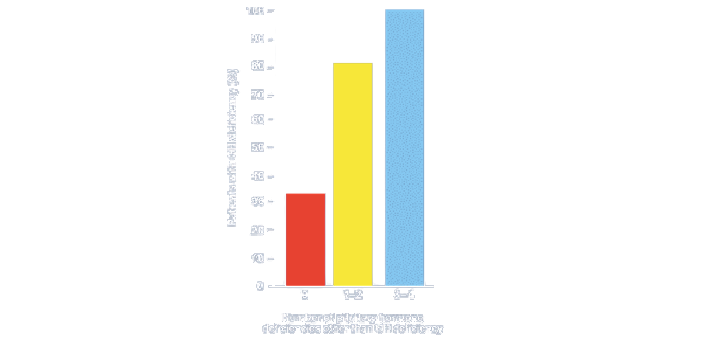
Sönksen PH et al. In: Adashi EY, Thorner MO, eds. The somatotrophic axis of the reproductive process in health and disease. New
York: Springer-Verlag, 1995
Causes of pituitary insufficiency in 333 patients
Cause
Idiopathic (unknown)
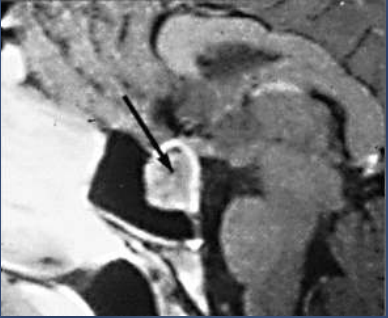
Pituitary adenoma
Craniopharyngioma
Meningioma
Cholesteatoma
Pinealoma
Dysgerminoma
Myxogerminoma
Chordoma
Astrocytoma
Arachnoidal cyst
Benign cyst teratoma
Undifferentiated tumor
Number of patients
53
223
34
7
2
1
1
1
1
1
1
1
7
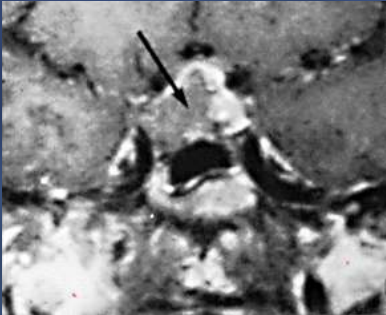
MRI scans of pituitary adenoma
Characteristic clinical features of growth hormone deficiency in adults
• Increased fat mass
• Reduced lean body mass
• Decreased extracellular water (dry, thin skin)
• Low bone density
• Impaired cardiac function
• Poor physical performance
• Impaired psychological well-being
Symptoms and signs of GH deficiency in adults
Increased abdominal adiposity
Symptoms
Decreased psychological well-being
Reduced strength and physical endurance
Thin, dry skin
Signs
Truncal obesity
Increased waist:hip ratio
Thin, dry skin
Abnormal body composition
- Decreased lean body mass
- Increased body fat
- Reduced extracellular water
Decreased psychological well-being
Reduced exercise performance
Abnormal cardiac structure and function
Cardiovascular risk factors
- Hyperlipidemia
- Decreased fibrinolysis
- Increased atherosclerosis
Decreased bone density
Disturbed renal function
- Reduced glomerular filtration rate
- Reduced renal plasma flow
Lowered basal metabolic rate
Increased insulin
resistance
Modified from Cuneo et al. Clin Endocrinol 1992; 37: 387-97
GH secretion varies throughout life
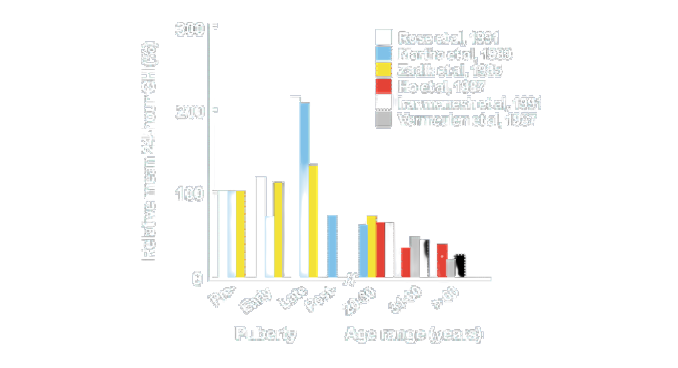
Ho KY, Hoffman DM. In: Laron Z, Butenandt O, eds. Growth hormone replacement therapy in adults – pros and cons.
Tel Aviv/London: Freund Publishing House, 1993: 5-1
6
Actions of growth hormone
Anabolic action (muscle building)
Lipolytic action
Stimulation of bone and cartilage growth
CNS action
GH replacement therapy has beneficial effects on body composition
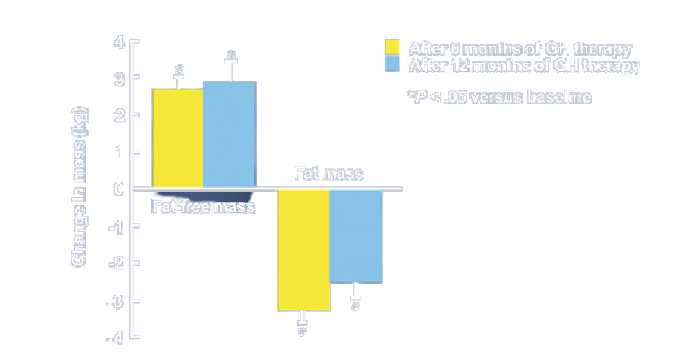
Mårdh G et al. Endocrinol Metab 1994; 1 (Suppl A): 43-9
GH replacement therapy increases protein and muscle synthesis
Russell-Jones DL et al. Acta Endocrinol 1993; 128 (Suppl 2): 44-7
Actions of growth hormone
Anabolic action
Lipolytic action (fat burning)
Stimulation of bone and cartilage growth
CNS action
Two years of GH replacement therapyreduces body fat
Johannsson G et al. Endocrinol Metab 1996: 3 (Suppl A): 3-12
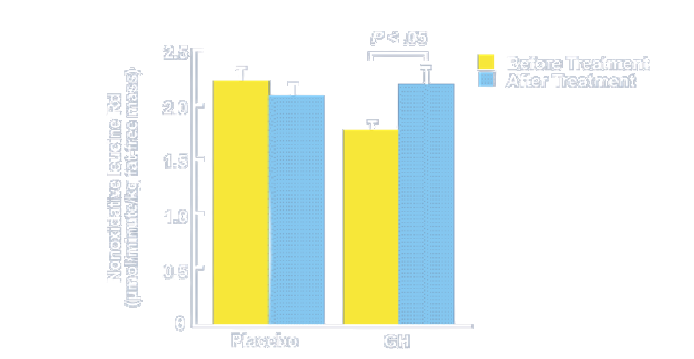
The role of GH in fat metabolism
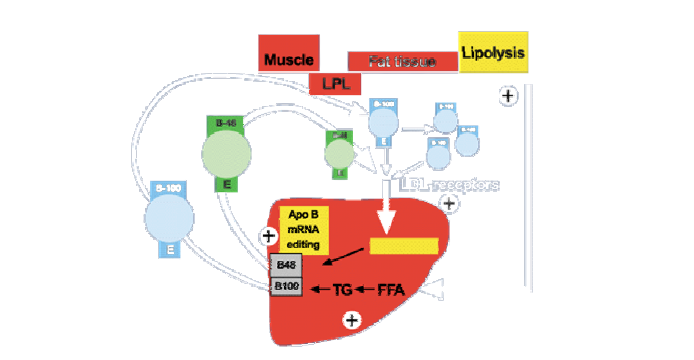
With kind permission of Professor B Angelin
GH has net beneficial effect on lipid metabolism (reducing excess fats)
0 months 12 months 24 months
Cholesterol P 234 (59) 233 (48) 232 (44)
(mg/dL) V 269 (56) 231 (60)*** 226 (50)***
LDL Cholesterol P 167 (56) 168 (49) 159 (45)
(mg/dL) V 191 (51) 160 (59)** 151 (52)***
TC/HDL-C P 5.9 (1.9) 5.8 (1.5) 5.3 (2.2)
V 7.6 (3.3) 5.6 (2.0)** 5.4 (1.7)**
LDL-C/HDL-C P 4.3 (1.7) 4.1 (1.4) 3.7 (2.0)
V 5.2 (2.1) 3.9 (1.8)** 3.6 (1.5)**
Lp (a) P 9.5 8.4 11.8++
(0.4 – 44.8) (0.6 – 54.0) (1.2 – 89.1)
V 6.7 9.0 10.6
(0.5 – 87.4) (0.7 – 181.0) (1.05 – 162.0)
Table 2, Nolte, p 137.
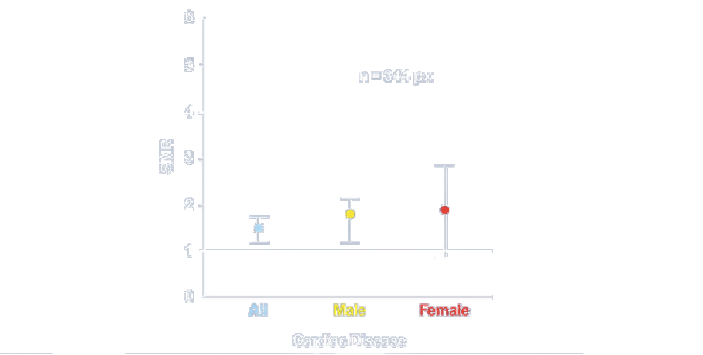
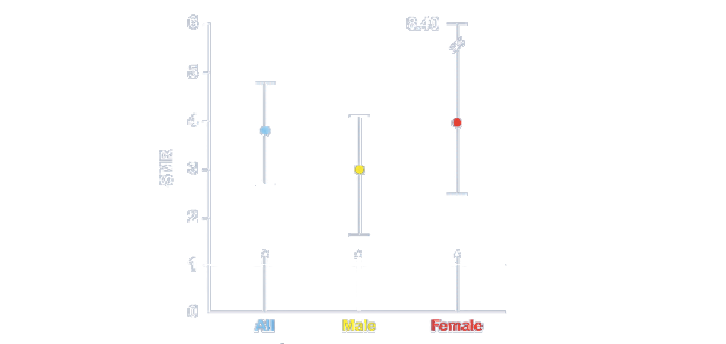
Cardiovascular death is higher in patients with GH deficiency

Rosèn and Bengtsson. Lancet 1990; 336: 285-8; 77: 1671-6
Cardiovascular death is higher in GH Deficiency
Bülow B et al. The effects of 10 years of recombinant human growth hormone (GH) in adult GH-deficient patients.
J Clin Endocrinol Metab. 1997; 46: 75-81.
Cerebrovascular disease is higher
Cerebrovascular Disease
Bülow B et al. The effects of 10 years of recombinant human growth hormone (GH) in adult GH-deficient patients.
J Clin Endocrinol Metab. 1997; 46: 75-81.
Myocardial contractility (heart pumping) is improved after GH therapy
Amato et al. J Clin Endocrinol Metab 1993; 77: 1671-6
Actions of growth hormone
Anabolic action
Lipolytic action
Stimulation of bone and cartilage growth
CNS action
Bone mineral density and strength decreases in GH Deficiency
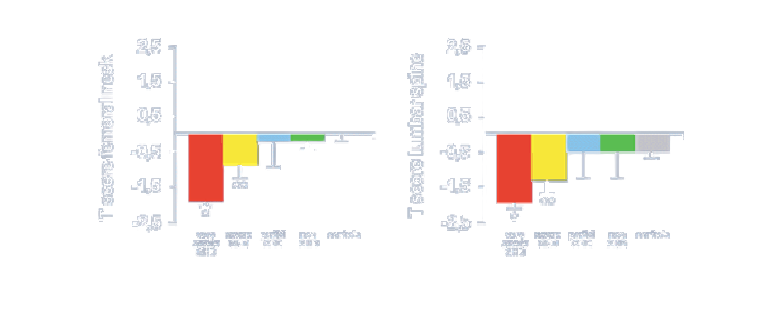
Colao A et al. JCEM 84:1919, 1999
Fig. 1. Lumbar spine BMD (right panel) and femoral neck BMD (left panel) evaluated as t scores in the five groups of subjects
divided on the basis of the GH response to ARG+GHRH test: very severe GHD, GH peak below 3 µg/L; severe GHD, GH peak
between 3. 1-9 µg/L; partial GHD, peak between 9.1-16.5 ug/L; non-GHD, GH peak above 16.5 µg/L; and controls, GH peak
above 16.5 µg/L. *, P < .001, group 1 vs. groups 3-5. **, P < .05, group 2 vs. groups 1 and 5.
Fractures increase with GH Deficiency
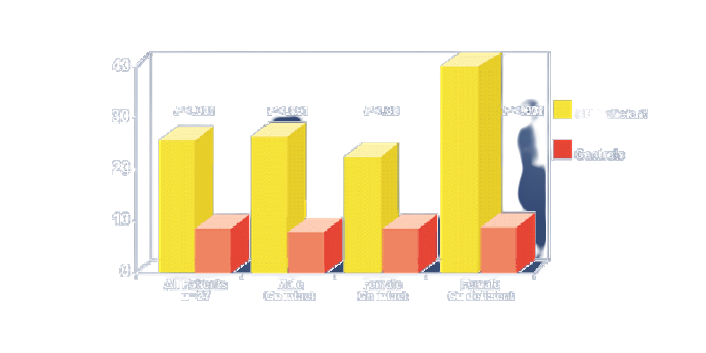
Rosèn et al, Eur J Endocrinol 1997
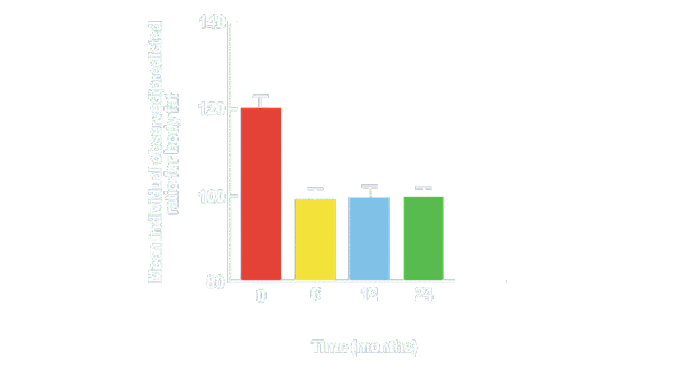
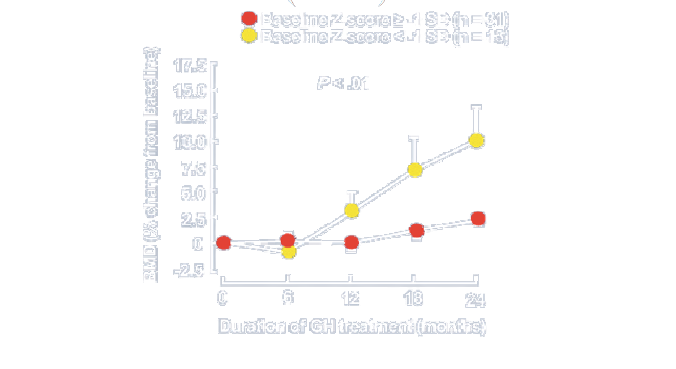
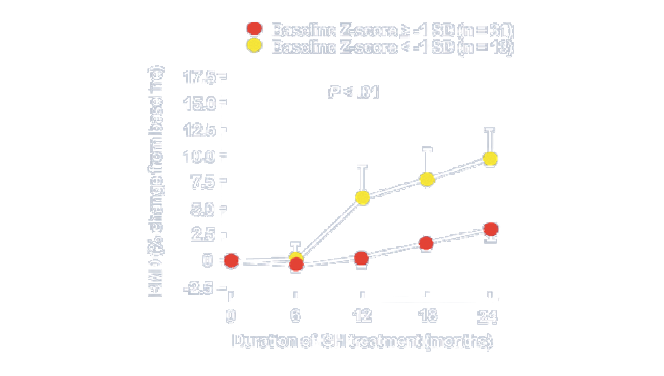
Long-term GH replacement therapy increases forearm Bone Density
Vandeweghe M et al. Clin Endocrinol (Oxf) 1993; 39: 409-15
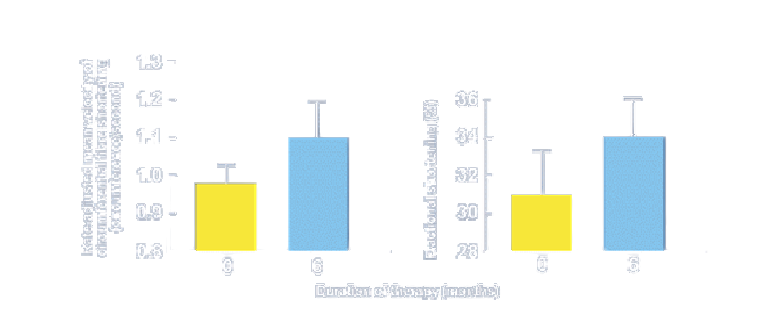
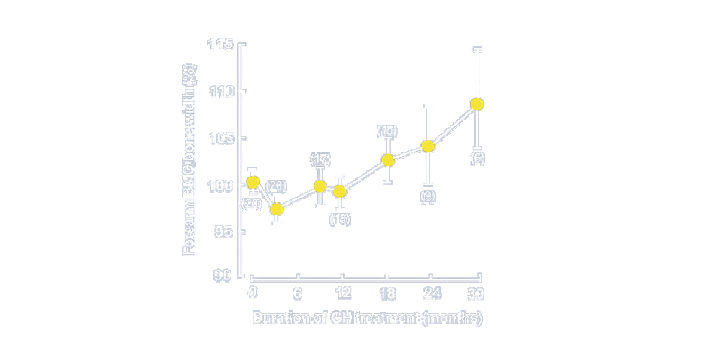
Two years of GH replacement therapy increases Bone Density in the lumbar spine (L2-L4)
Two years of GH replacement therapy increases Bone Density in the femoral neck
Actions of growth hormone
Anabolic action
Lipolytic action
Stimulation of bone and cartilage growth
CNS action (Nervous System Rebuilding)
GH replacement therapy improves energy based on the Nottingham Health Profile
GH replacement therapy improves social isolation scores of the Nottingham Health Profile
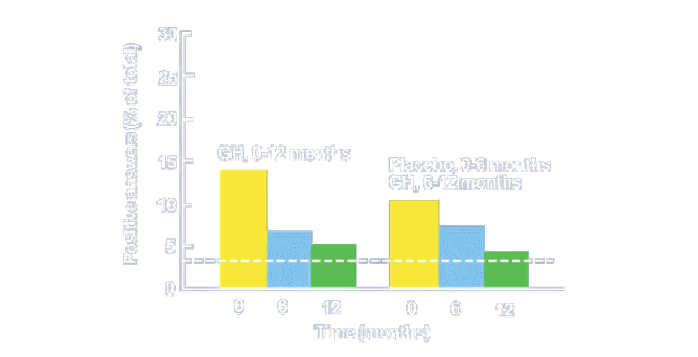
Mårdh G et al. Endocrinol Metab 1994; 1 (Suppl A): 43-9
The dose of GH used for replacement therapy must be tailored to the needs of the patient
Treatment should start with a low dose, which should be increased gradually until symptoms abate and IGF-I levels are normalized
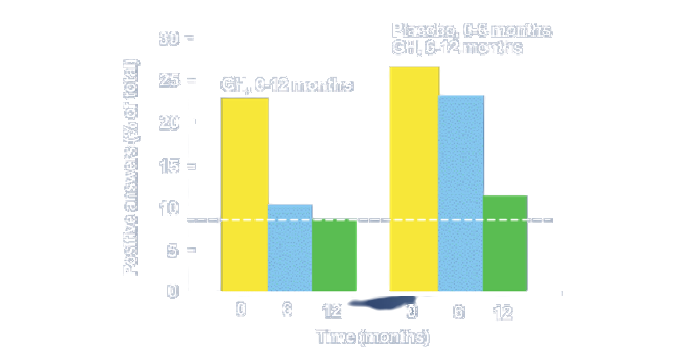
Energy level and emotions are better based on the Nottingham Health Profile
• NHP revealed improvements in overall score
• Improved energy levels and emotional score
in GH treated 10-year group vs. untreated
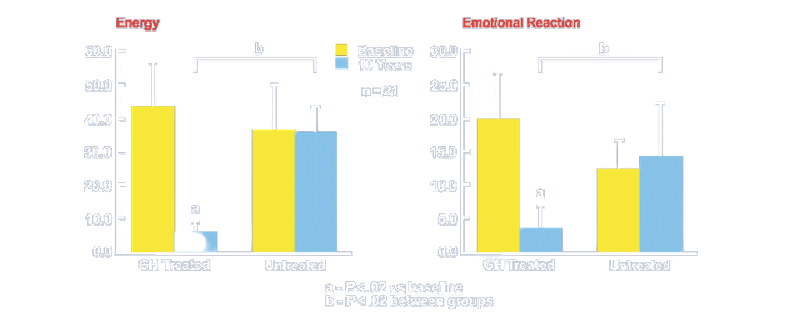
Gibney J et al. The effects of 10 years of recombinant human growth hormone (GH) in adult GH-deficient patients.
J Clin Endocrinol Metab. 1999; 84: 2596-2602.
GH Deficiency causes more body fat
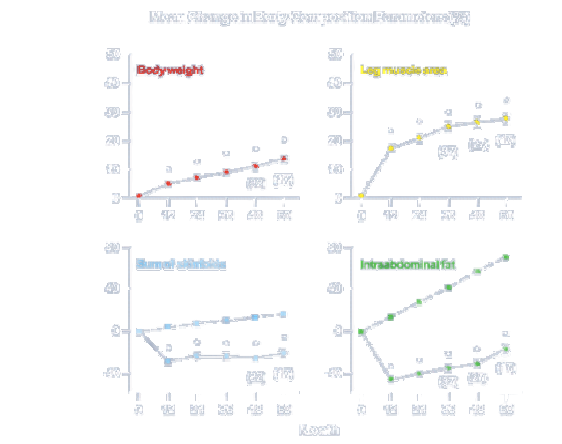
Fig. 1. Mean (
±SE) measured
(•) and expected ( ) changes
in body composition
parameters from baseline
values in men with GHD
receiving GH for 5 yr. Data are
shown for body weight, leg
muscle area (measured by
computed tomographic
scanning), sum of skinfolds
(measured at seven sites with
a Harpenden skinfold caliper),
and intraabdominal fat
(measured by computed
tomographic scanning). n = 38
unless stated otherwise. *,
P < .001 for comparison of
changes from baseline.
Ter Maaten et al.
Long-term GH replacement increases bone density
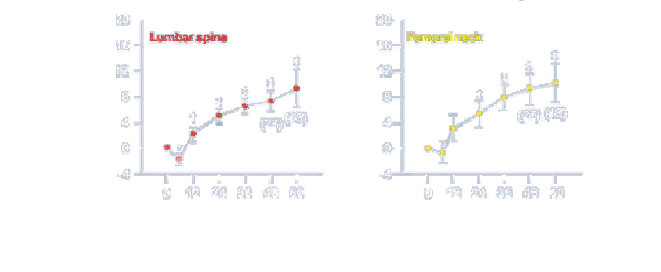
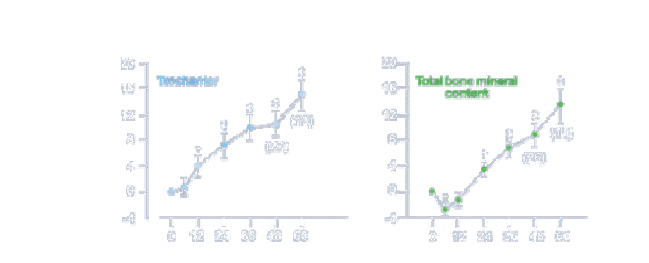
Fig. 2. Mean (
±SE) changes in
BMD/bone mineral content
from baseline values in men
with GHD receiving GH for
5 yr. Data are shown for BMD
of the spine, femoral neck, and
trochanter and for total bone
mineral content (measured
by dual energy x-ray
absorptiometry).
n = 38 unless stated
otherwise. *,
P < .05; †,
P < .01;
‡,
P < .001 (for comparison of
changes from baseline).
How It Feels to be GH Deficient!